
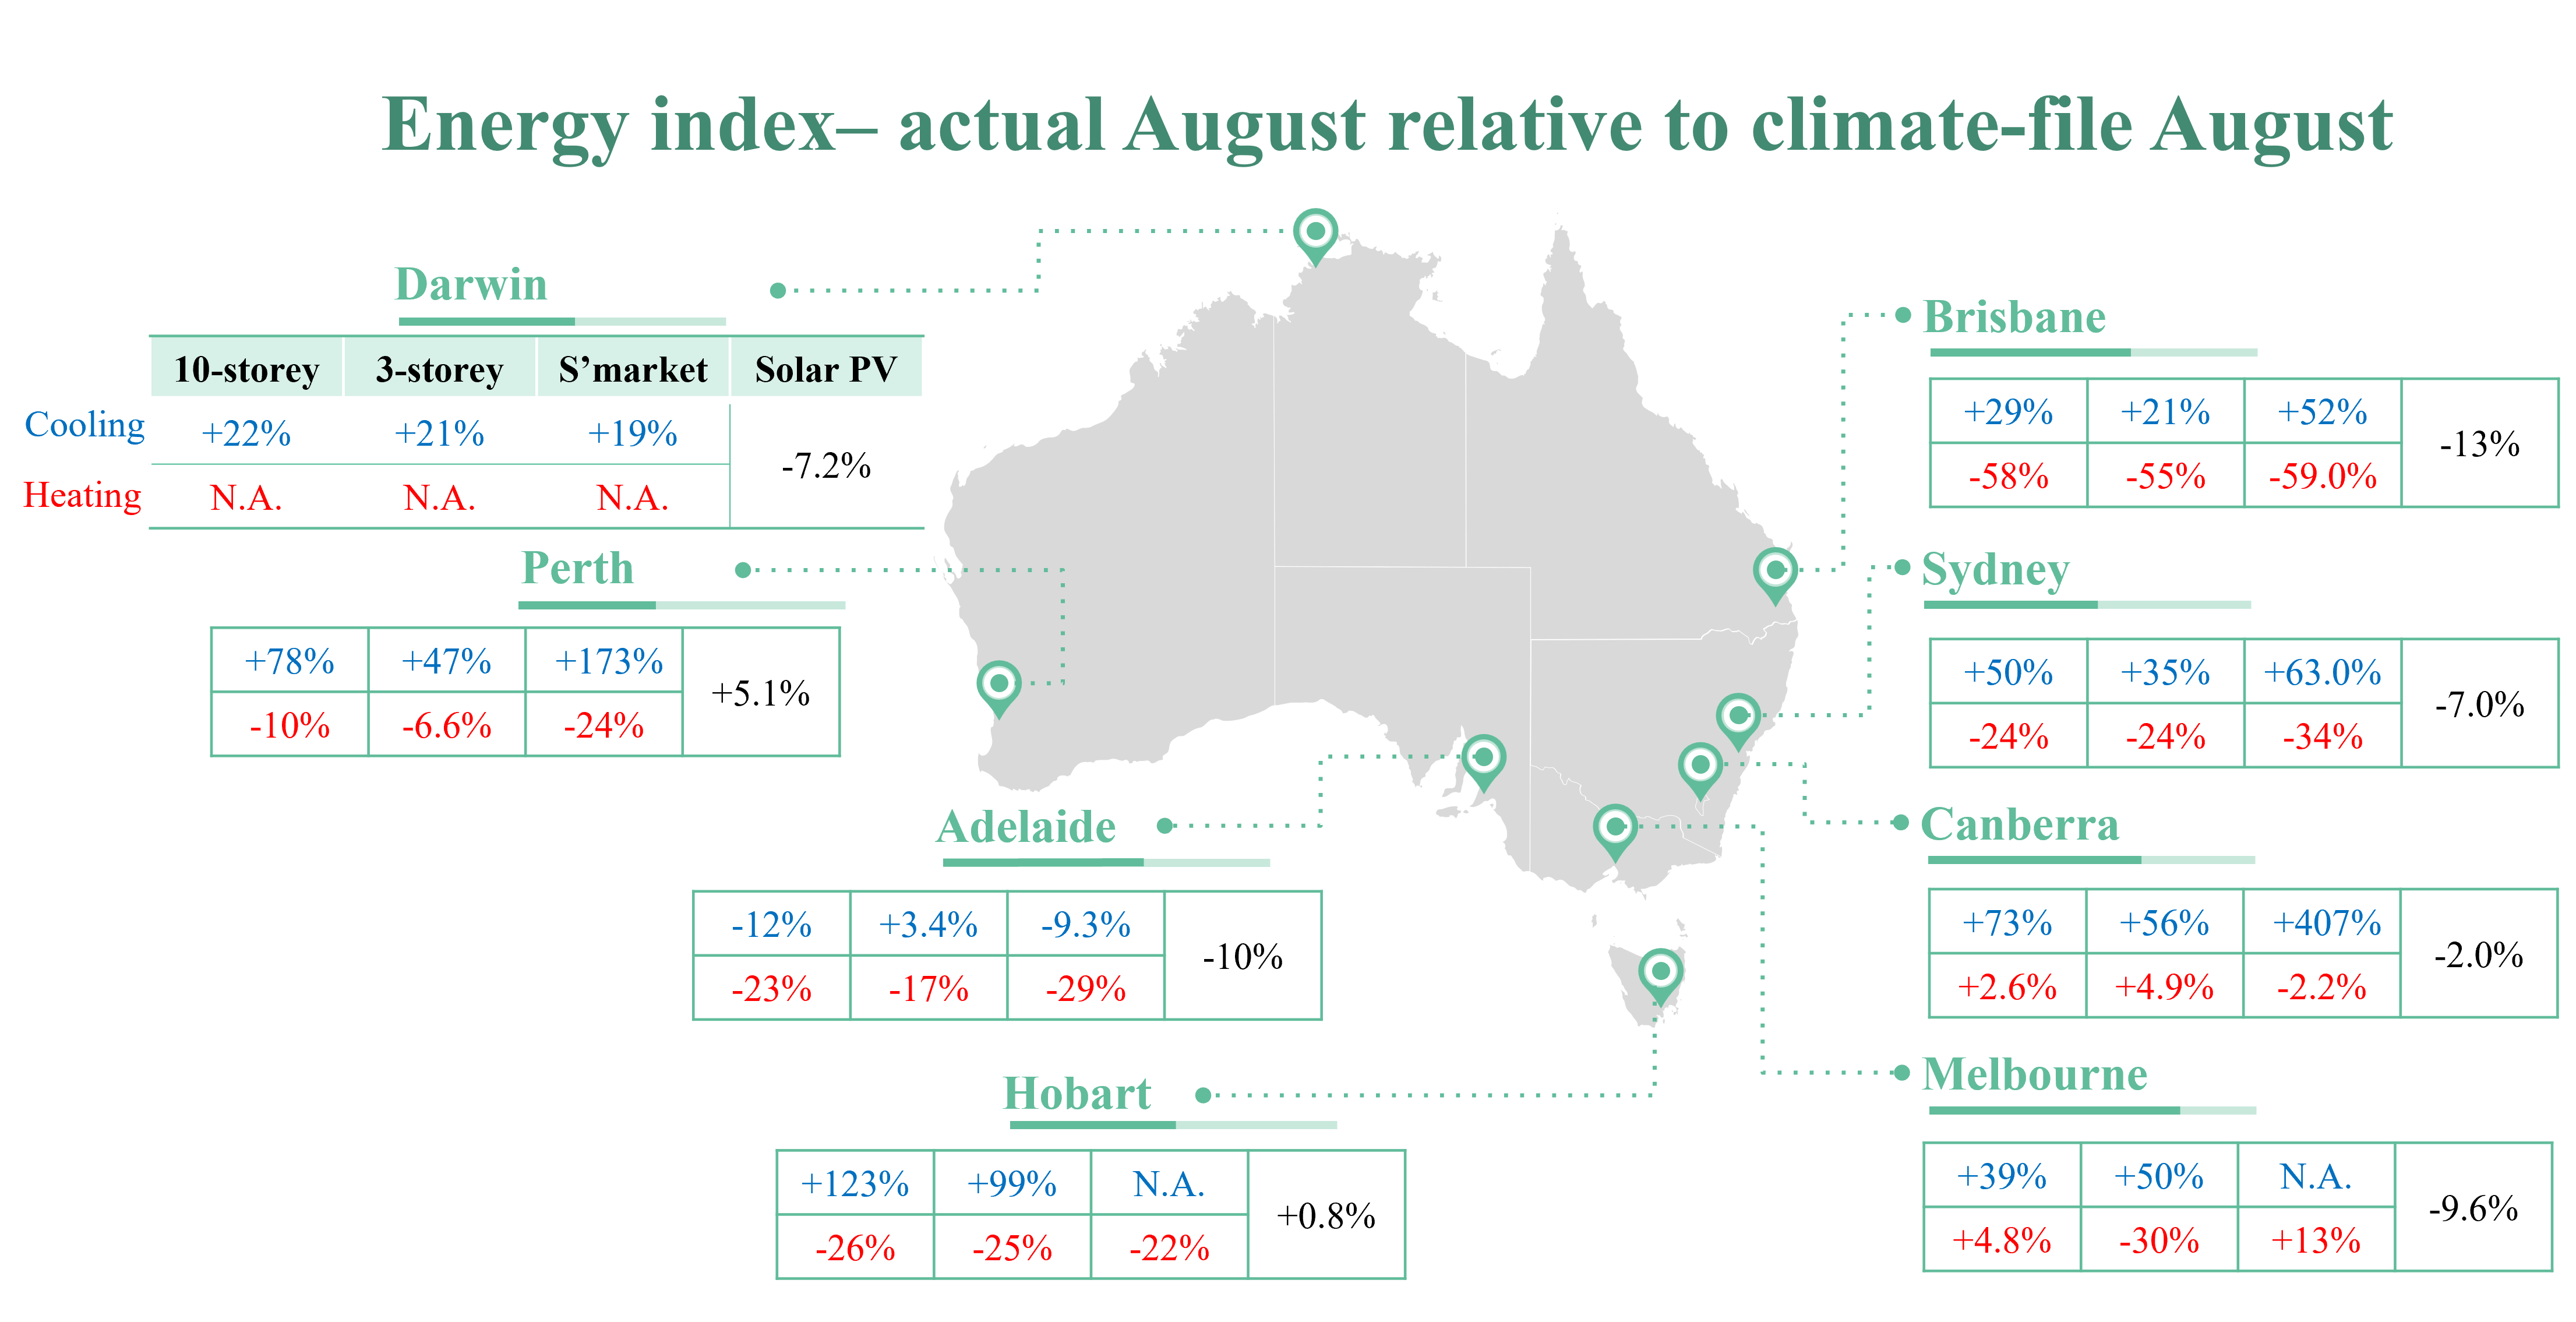
The Exemplary Real Time Year weather files (RTYs), current Reference Meteorological Year files (RMYs) and Ersatz Future Meteorological Years (EFMYs) used for these monthly simulations are available for purchase. This will allow clients to simulate their own designs for energy budgeting and monitoring rather than rely on analogy with the performance of these archetypical buildings and systems. Especially in mild months, small differences in energy consumptions can result in large percentage differences. Solar irradiation data courtesy of Solcast.
Archetypical buildings and systems

10-storey office

3-storey office

Supermarket

5 kW domestic
PV system
Get the Best out of our Interactive Features
This monthly report has been interactive since April 2023. Once you have scrolled to your city of interest, check out those interactive features and how they work. Click here to read about the introduction.
- 1. Choose the energy or peak demand graph to best match your building or system of interest.
- 2. Choose the weather element graph to best match the sensitivity of your building or system of interest.
- 3. Mix and match to learn about their relative importance or sensitivity
All values are % higher/lower energy demand/output relative to climatically typical weather.
Especially during the mild seasons, large % changes can occur from small absolute differences. RTYs are available for purchase for your own simulations.
ADELAIDE
Energy Index (%)
| 10-storey | 3-storey | Supermarket | |||
| Heating | Cooling | Heating | Cooling | Heating | Cooling |
| -22.8% | -11.5% | -16.6% | +3.4% | -28.6% | -9.3% |
| Solar PV | |||||
| -10.4% |
The solar PV simulation output was 10.4% lower than the long-term average. The heating peak loads were lower than the long-term average for the 3-storey office, 10-storey office and supermarket, by 31.3%, 27.3% and 25.6%, respectively. It should be noted that peak load results are highly sensitive to the particular building and HVAC design and settings – it is more appropriate to evaluate those results from the bespoke building model (digital twin) using our RTY data.
Adelaide experienced slightly warmer temperatures and higher relative humidity in August, while GHI and wind speeds were lower than the long-term averages.
Weather Index
| Temperature (°C) | ||
| Mean Min | Mean Avg | Mean Max |
| +0.6 | +0.6 | +0.5 |
| Relative Humidity (%pt) | ||
| Mean Min | Mean Avg | Mean Max |
| +12.5 | +8.7 | +3.3 |
| Daily Solar Irradiation (GHI %) | ||
| Cloudiest | Mean | Sunniest |
| -38.5 | -7.5 | +3.7 |
BRISBANE
Energy Index (%)
| 10-storey | 3-storey | Supermarket | |||
| Heating | Cooling | Heating | Cooling | Heating | Cooling |
| -58.1% | +28.8% | -54.6% | +21.3% | -59.0% | +52.2% |
| Solar PV | |||||
| -12.5% |
The solar PV simulation output was 12.5% lower than the long-term average. The heating peak loads were lower than the long-term average for the 3-storey office, 10-storey office and supermarket, by 26.4%, 21.0% and 33.9%, respectively. It should be noted that peak load results are highly sensitive to the particular building and HVAC design and settings – it is more appropriate to evaluate those results from the bespoke building model (digital twin) using our RTY data.
Brisbane experienced temperatures similar to the long-term average during the daytime in August, but higher temperatures from the evening through to the morning. Relative humidity was much higher, while GHI was considerably lower. Wind speeds were below the long-term average during the daytime but higher during other periods.
Weather Index
| Temperature (°C) | ||
| Mean Min | Mean Avg | Mean Max |
| +3.0 | +1.3 | -0.1 |
| Relative Humidity (%pt) | ||
| Mean Min | Mean Avg | Mean Max |
| +16.6 | +10.7 | +4.5 |
| Daily Solar Irradiation (GHI %) | ||
| Cloudiest | Mean | Sunniest |
| -31.4 | -9.7 | -8.1 |
CANBERRA
Energy Index (%)
| 10-storey | 3-storey | Supermarket | |||
| Heating | Cooling | Heating | Cooling | Heating | Cooling |
| +2.6% | +72.8% | +4.9% | +55.6% | -2.2% | +407.4% |
| Solar PV | |||||
| -2.0% |
The solar PV simulation output was 2.0% lower than the long-term average. The heating peak loads were higher than the long-term average for 3-storey office building and 10-storey office building by 8.1% and 8.9% while supermarket is slightly lower by 0.2%. It should be noted that peak load results are highly sensitive to the particular building and HVAC design and settings – it is more appropriate to evaluate those results from the bespoke building model (digital twin) using our RTY data.
Canberra experienced slightly warmer daytime temperatures in August, while relative humidity was substantially higher throughout the day compared with the long-term average. GHI was similar to the long-term average, while wind speeds were generally lower.
Weather Index
| Temperature (°C) | ||
| Mean Min | Mean Avg | Mean Max |
| +0.0 | +0.2 | +0.9 |
| Relative Humidity (%pt) | ||
| Mean Min | Mean Avg | Mean Max |
| +10.3 | +10.5 | +6.9 |
| Daily Solar Irradiation (GHI %) | ||
| Cloudiest | Mean | Sunniest |
| +10.4 | +0.8 | +3.4 |
DARWIN
Energy Index (%)
| 10-storey | 3-storey | Supermarket | |||
| Heating | Cooling | Heating | Cooling | Heating | Cooling |
| N.A. | +22.3% | N.A. | +21.3% | N.A. | +19.4% |
| Solar PV | |||||
| -7.2% |
The solar PV simulation output was 7.2% lower than the long-term average. The cooling peak loads were higher than the long-term average for the 3-storey office building and 10-storey office building by 9.9% and 10.6% while supermarket is slightly lower by 0.1%. It should be noted that peak load results are highly sensitive to the particular building and HVAC design and settings – it is more appropriate to evaluate those results from the bespoke building model (digital twin) using our RTY data.
Darwin experienced warmer temperatures than the long-term average in August, along with higher relative humidity. GHI and wind speeds were below the long-term average for most of the day.
Weather Index
| Temperature (°C) | ||
| Mean Min | Mean Avg | Mean Max |
| +1.5 | +1.3 | +1.0 |
| Relative Humidity (%pt) | ||
| Mean Min | Mean Avg | Mean Max |
| +7.4 | +4.9 | +2.3 |
| Daily Solar Irradiation (GHI %) | ||
| Cloudiest | Mean | Sunniest |
| -2.3 | -3.6 | -0.6 |
HOBART
Energy Index (%)
| 10-storey | 3-storey | Supermarket | |||
| Heating | Cooling | Heating | Cooling | Heating | Cooling |
| -25.5% | +123.4% | -24.9% | +98.9% | -21.6% | N.A. |
| Solar PV | |||||
| +0.8% |
The solar PV simulation output was 0.8% higher than the long-term average. The heating peak loads were slightly higher than the long-term average for 3-storey office building and 10-storey office building by 3.4% and 1.6% while supermarket is lower by 12.9%. It should be noted that peak load results are highly sensitive to the particular building and HVAC design and settings – it is more appropriate to evaluate those results from the bespoke building model (digital twin) using our RTY data.
Hobart experienced warmer temperatures and similar humidity levels in August compared with the long-term average. GHI was much higher while wind speeds were lower than the long-term average.
Weather Index
| Temperature (°C) | ||
| Mean Min | Mean Avg | Mean Max |
| +1.1 | +1.0 | +1.5 |
| Relative Humidity (%pt) | ||
| Mean Min | Mean Avg | Mean Max |
| +0.5 | +1.3 | +0.1 |
| Daily Solar Irradiation (GHI %) | ||
| Cloudiest | Mean | Sunniest |
| -15.7 | +3.2 | -0.5 |
MELBOURNE
Energy Index (%)
| 10-storey | 3-storey | Supermarket | |||
| Heating | Cooling | Heating | Cooling | Heating | Cooling |
| +4.8% | +38.8% | -29.7% | +50.4% | +12.5% | N.A. |
| Solar PV | |||||
| -9.6% |
The solar PV simulation output was 9.6% lower than the long-term average. The heating peak loads were lower than the long-term average for 3-storey office building and supermarket by 7.8% and 1.6% while 10-storey office building is higher by 22.1%. It should be noted that peak load results are highly sensitive to the particular building and HVAC design and settings -it is more appropriate to evaluate those results from the bespoke building model (digital twin) using our RTY data.
Melbourne experienced warmer daytime temperatures and substantially higher relative humidity in August compared with the long-term average, while GHI remained similar to the long-term average.
Weather Index
| Temperature (°C) | ||
| Mean Min | Mean Avg | Mean Max |
| -0.7 | +0.0 | +1.1 |
| Relative Humidity (%pt) | ||
| Mean Min | Mean Avg | Mean Max |
| +2.0 | +6.7 | +10.0 |
| Daily Solar Irradiation (GHI %) | ||
| Cloudiest | Mean | Sunniest |
| -42.2 | -0.3 | -10.9 |
PERTH
Energy Index (%)
| 10-storey | 3-storey | Supermarket | |||
| Heating | Cooling | Heating | Cooling | Heating | Cooling |
| -10.2% | +77.6% | -6.6% | +47.1% | -24.3% | +172.6% |
| Solar PV | |||||
| +5.1% |
The solar PV simulation output was 5.1% higher than the long-term average. The heating peak loads were significantly higher than the long-term average for the 3-storey and 10-storey office buildings, by 67.0% and 71.0%, respectively, while the supermarket showed a smaller increase of 7.6%. It should be noted that peak load results are highly sensitive to the particular building and HVAC design and settings – it is more appropriate to evaluate those results from the bespoke building model (digital twin) using our RTY data.
Perth experienced slightly warmer temperatures than the long-term average in August, along with similar relative humidity. GHI was also similar to the long-term average, while wind speeds were lower than the long-term average from the afternoon through to the morning.
Weather Index
| Temperature (°C) | ||
| Mean Min | Mean Avg | Mean Max |
| +0.6 | +1.2 | +1.8 |
| Relative Humidity (%pt) | ||
| Mean Min | Mean Avg | Mean Max |
| -0.7 | -0.2 | -1.0 |
| Daily Solar Irradiation (GHI %) | ||
| Cloudiest | Mean | Sunniest |
| +3.5 | +2.5 | -5.8 |
SYDNEY
Energy Index (%)
| 10-storey | 3-storey | Supermarket | |||
| Heating | Cooling | Heating | Cooling | Heating | Cooling |
| -23.8% | +50.4% | -23.6% | +34.6% | -34.2% | +63.0% |
| Solar PV | |||||
| -7.0% |
The solar PV simulation output was 7.0% lower than the long-term average. The heating peak loads were lower than the long-term average for the 3-storey office, the 10-storey office and the supermarket by 4.4%, 0.9% and 24.4%, respectively. It should be noted that peak load results are highly sensitive to the particular building and HVAC design and settings – it is more appropriate to evaluate those results from the bespoke building model (digital twin) using our RTY data.
Sydney experienced warmer temperatures and higher relative humidity in August compared with the long-term average. Both GHI and wind speeds were lower than the long-term average.
Weather Index
| Temperature (°C) | ||
| Mean Min | Mean Avg | Mean Max |
| +1.3 | +0.8 | +0.6 |
| Relative Humidity (%pt) | ||
| Mean Min | Mean Avg | Mean Max |
| +8.8 | +10.9 | +7.7 |
| Daily Solar Irradiation (GHI %) | ||
| Cloudiest | Mean | Sunniest |
| -5.7 | -3.6 | -2.5 |